A 3-14 team and a 12-5 team run roughly the same number of plays each game. They gain the same yards on most of them. Hand off for three, throw a slant for seven, get stuffed on second and short, punt, and do it all over again, and if you graded every snap for each team, you would have a hard time telling which pile belonged to which team.
But, there are about six snaps a game that go one way for one of them and the other way for the other, and that’s the game, and the whole season. That’s the gap between a coach getting fired and a coach getting an extension.
I wanted to know how big that gap actually is, so I graded every run and pass from every game, 2019 through 2025, from the offense’s point of view. A snap is good if it scores, converts a first down, or gains five or more yards. It’s bad if it’s a turnover, a sack, a play held to zero or less, or a third or fourth down that doesn’t convert. Everything else, a gain of one to four on first or second down, is nothing much. A good snap for the offense is a bad one for the defense and vice versa, so every play in the game lands on one side of the ledger for each team. Kneels, spikes, and special teams are out.
The 125 Snaps
A team runs about 62 plays a game and faces about 62. Here is what the 125 look like for the team that won and the team that lost.
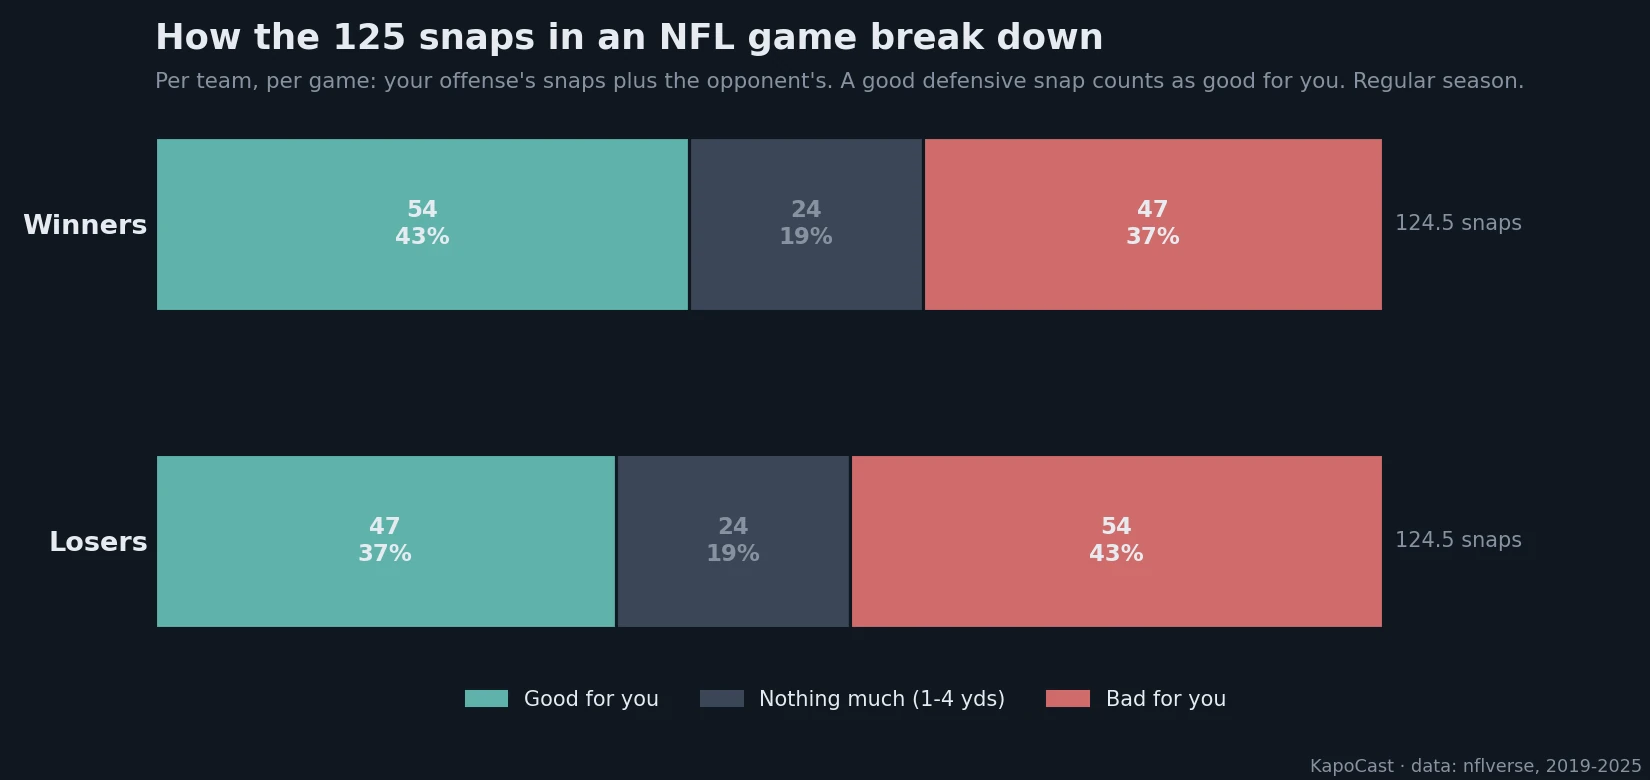
Winners get 54 good snaps a game, losers get 47. The nothing pile is exactly the same for both, ~24 snaps of a running back falling forward for two. So in the average NFL game, seven plays out of 125 decide it. The other 118 are a wash. Seven plays is one bad read, one dropped interception, a deep bomb, one tipped ball, one fourth-and-one. It’s a short list, and it’s the whole list.
Over a season it’s even tighter. Teams that won four games or fewer averaged 49 good snaps a game. Teams that won twelve or more averaged 55. Six snaps. The bad column goes 55 to 50, and the nothing column is still identical at about 21. Six plays a game separate the team picking first in the draft from the team with a bye, and they turned into ten points a game, 18.2 scored to 28.1 and 26.7 allowed to 20.6. The whole league lives inside a band about eleven points wide, 36% good on the low end to 47% on the high end, and the standard deviation across all 224 team-seasons is two points. Everybody is roughly a 42% team. A few of them are a 44% team and they’re the ones in January. The league is nearly perfectly balanced.
What the Six Snaps Are
If it’s only six, the next question is which six. I split the good snaps into levels, on offense a touchdown, a gain of 20 or more, 10 to 19, a first down of under ten, and a gain of 5 to 9 that didn’t convert, and on defense a takeaway, a third or fourth down stop, a sack, and a play held to no gain.
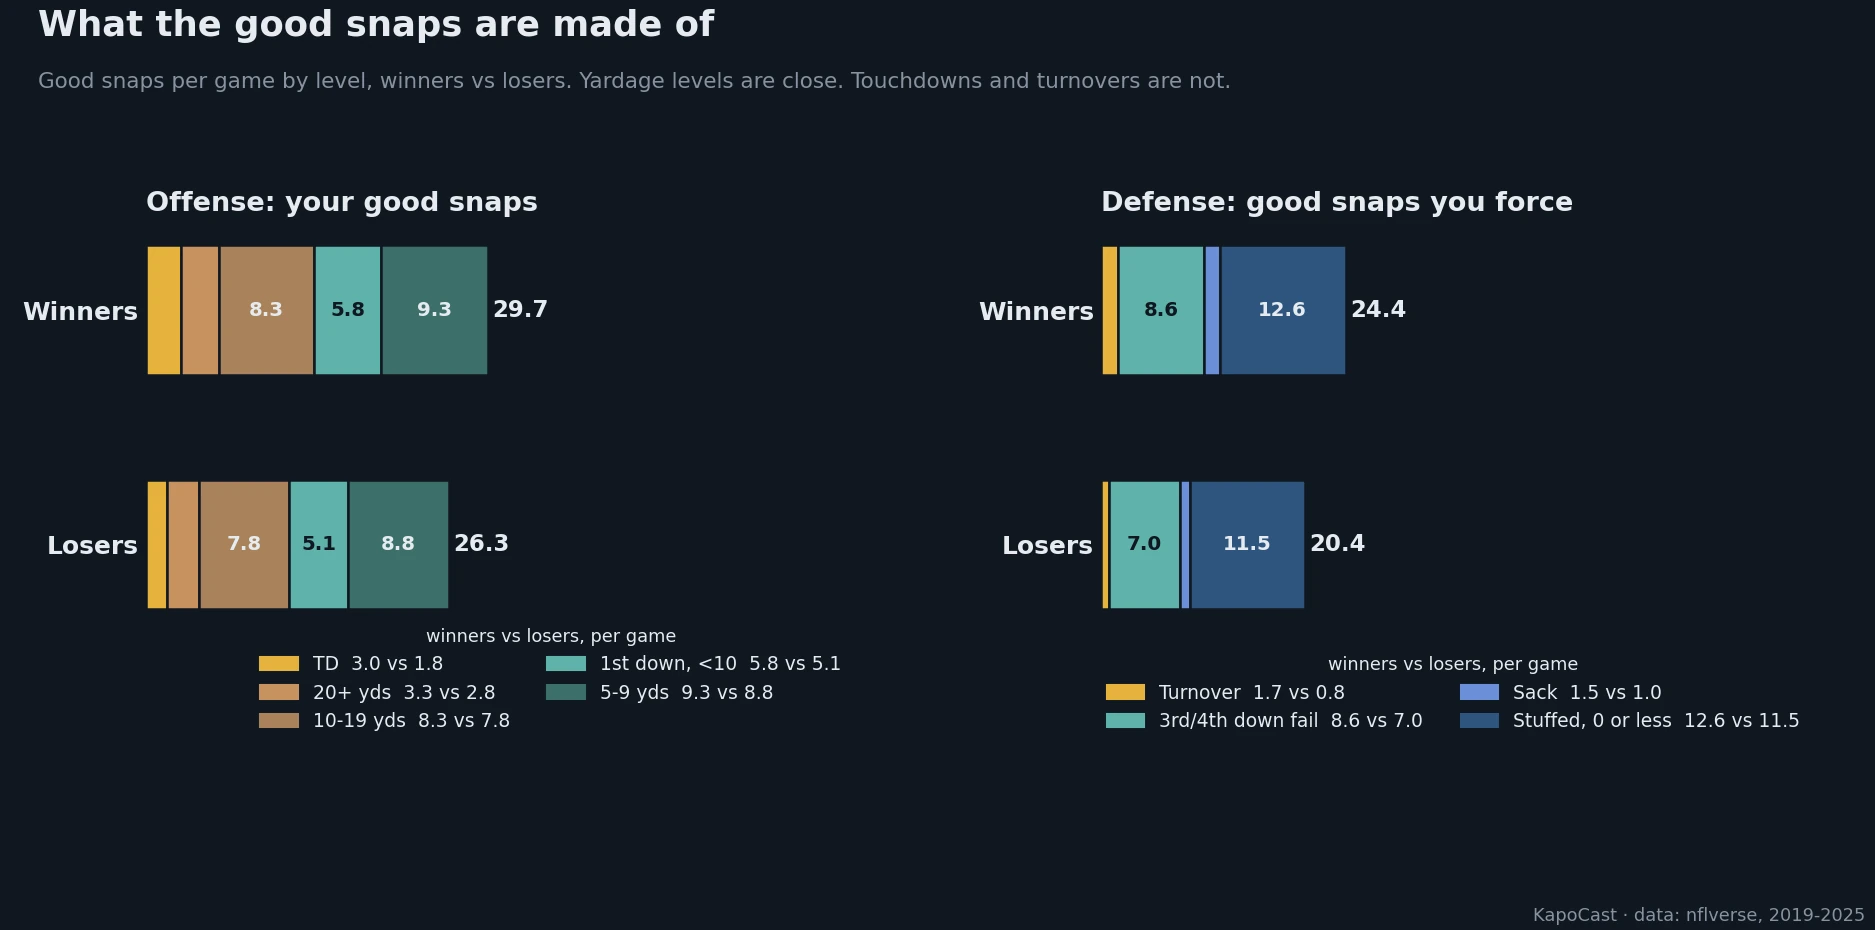
Look at the middle of the bars. Winners average 9.3 gains of 5 to 9 yards, losers 8.8. Gains of 10 to 19, 8.3 to 7.8. Twenty-yard plays, 3.3 to 2.8. The team that lost the game had, for all practical purposes, the same number of good-looking plays as the team that won it. They moved the ball. They picked up chunks. The highlight package for the loser is about as long as the highlight package for the winner. The bars only come apart at the very ends, touchdowns at 3.0 to 1.8 and takeaways at 1.7 to 0.8, and on the defensive side at third and fourth down stops, 8.6 to 7.0.
Everybody Moves the Ball
I sorted every category from most even to least even, because I wanted to see exactly where the two teams split:
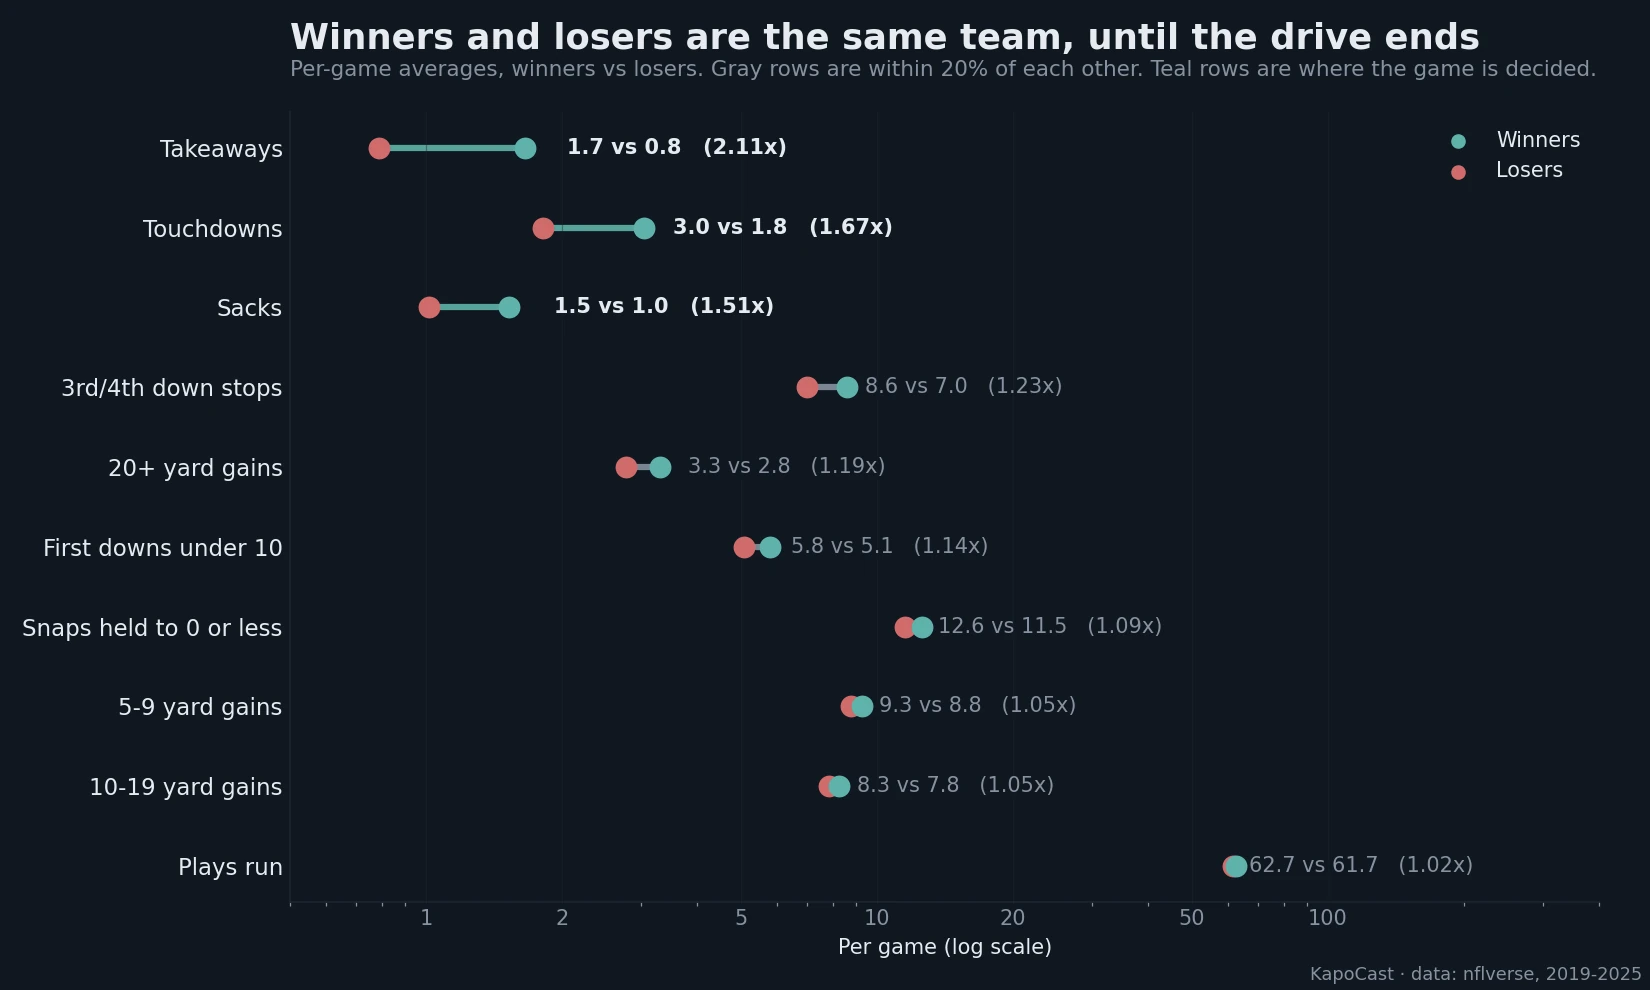
Plays run, 62.7 to 61.7. Gains of 10 to 19, within 5%. Gains of 5 to 9, within 5%. Plays held to nothing, within 9%. Even 20-yard plays, which feel like the game while you’re watching it, are within a fifth. The team that lost ran the same offense on the same number of snaps for the same yardage on the same number of plays. The only rows where they stop being the same team are the rows where a drive ends. Takeaways, 2.1 to 1. Touchdowns, 1.7 to 1. Sacks, 1.5 to 1. I ran the correlation between each category and winning to make sure the eye wasn’t fooling me. Drives that ended in points came in at 0.73, touchdowns 0.65, takeaways 0.51, fourth down stops 0.48. Every yardage category was under 0.22. You can gain 400 yards and lose. Teams do it every week. You cannot lose the takeaway battle by two and win very often.
So the two play types that matter are the two you'd guess. Takeaways are the obvious one. A turnover ends the drive on the spot and hands the other team the ball, so of course it's the biggest gap on the board and the highest correlation of any single play. Sacks are the other one. They don't always end the drive, but they can kill it slowly. One in five drives has a sack in it, and a drive with a sack ends in points 23% of the time against 43% for a drive without one. The touchdown rate goes from 27% to 8%. Even when you take the turnover out of it and only look at drives that were otherwise clean, a sack cuts the chance of scoring almost in half, 48% to 27%. That's what seven yards and a down does to a possession. Winners get 1.5 sacks a game, losers get 1.0, and the sack margin correlates with winning at 0.29, which is well below takeaways and touchdowns but above every yardage category in the sample. That's the reason it's the one big play with any real separation in it. A 20-yard completion is something both teams get three times a game. A sack is a 20-yard completion, backwards.
The Drive Is the Unit
If the yardage doesn’t decide it and the drive-enders do, then the play is the wrong thing to count. Both teams get about ten and a half drives a game. Both teams have 'good plays'. Winners score on five of those drives though. Losers score on three.
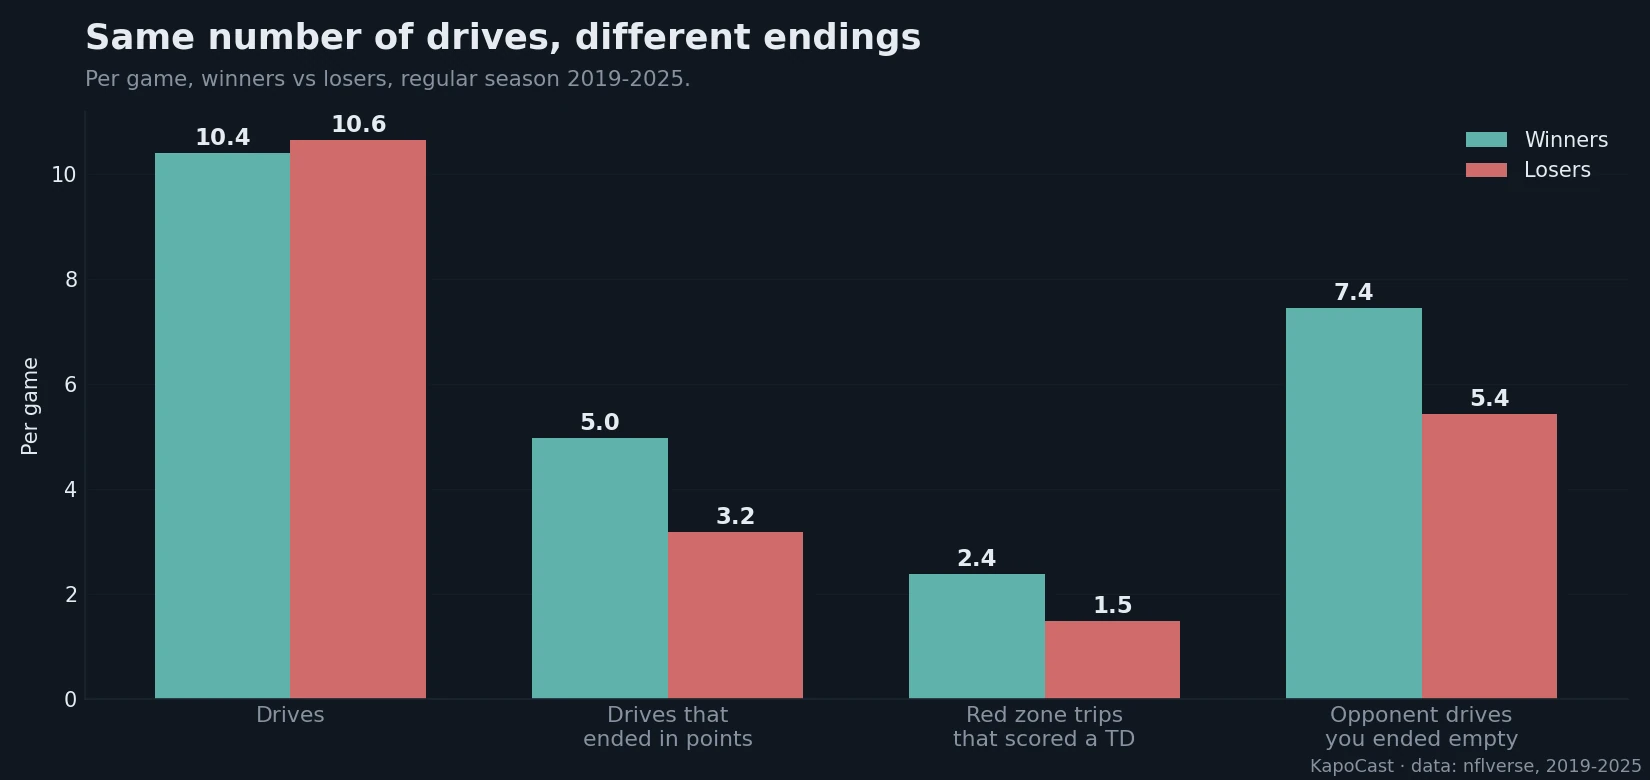
Winners finished 2.4 red zone trips with a touchdown to 1.5 for losers, and ended 7.4 of the opponent’s drives with nothing to 5.4. Same number of drives, same yardage in the middle of the field, two more finished and two more killed. That's why the 3-14 team and the 12-5 team can look close for three quarters of a game and not be.
The Playoffs
The margin doesn’t change in January. Playoff teams run the same 62 snaps, the same 42% good, and the same coin flip between 41 and 44. What changes is how much of the outcome rides on the six. Fourth down stops go from three to one in the regular season to four and a half to one. Takeaways go from 2.1 to 2.3. And the one yardage category that had any daylight in the regular season, the 10 to 19 yard gain, flips. Playoff losers had more of them than playoff winners. In the playoffs you can out-gain the other team and it means even less than it did in October.
Special teams is the piece I left out, and it belongs in the six snap gap. So it's probably closer to 7-8 per game. A muffed punt or a missed field goal ends a drive as surely as a fumble does. It just isn’t a play in the same sense, and mixing it in made the snap count meaningless. If anything it makes the point harder. A blocked kick is a game decided by one snap out of 125.
So here's where I land on the closeness question. The team that goes 3-14 and the team that goes 12-5 are running roughly the same game on 119 of every 125 snaps. The 3-14 team's coach is not on average calling worse plays on first and ten. Their running back is not getting fewer three-yard carries. The receivers are catching the same seven-yard slant. Then a drive gets to third and six and the ball comes out, and one team does the thing and the other doesn't, six times a game, seventeen games in a row. That's the NFL. It is a lot closer than the standings make it look, and if you want to see it happen in real time, the Titans lost a game this week they won on every stat but the six.