Everybody agrees the quarterback position has changed. I wanted to know if QBs have actually gotten better as a whole. If there are more elite quarterbacks now than there used to be or the guys we call elite today are a little less special than we think. If there are the same number of elite guys and a lot fewer bad ones, then the position didn’t get more top-heavy, the floor just came up under everybody.
I took every quarterback season from 1999 through 2025 with at least 200 dropbacks, nearly a thousand of them, about 36 a year, and graded each one on a composite of EPA per play with rushing included, passer rating, touchdown rate, interception rate, and sack rate. Then I sorted every season into four tiers, elite, good, average, and bad. The tiers are not a quota. A season clears a threshold or it doesn’t, and in most years that works out to four or five elite seasons, eight to twelve good ones, a dozen or so average, and eight to eleven bad. This is not a ranking and I’m not arguing for anybody. It’s what the seasons graded out to.
The Floor Moved, the Ceiling Didn’t
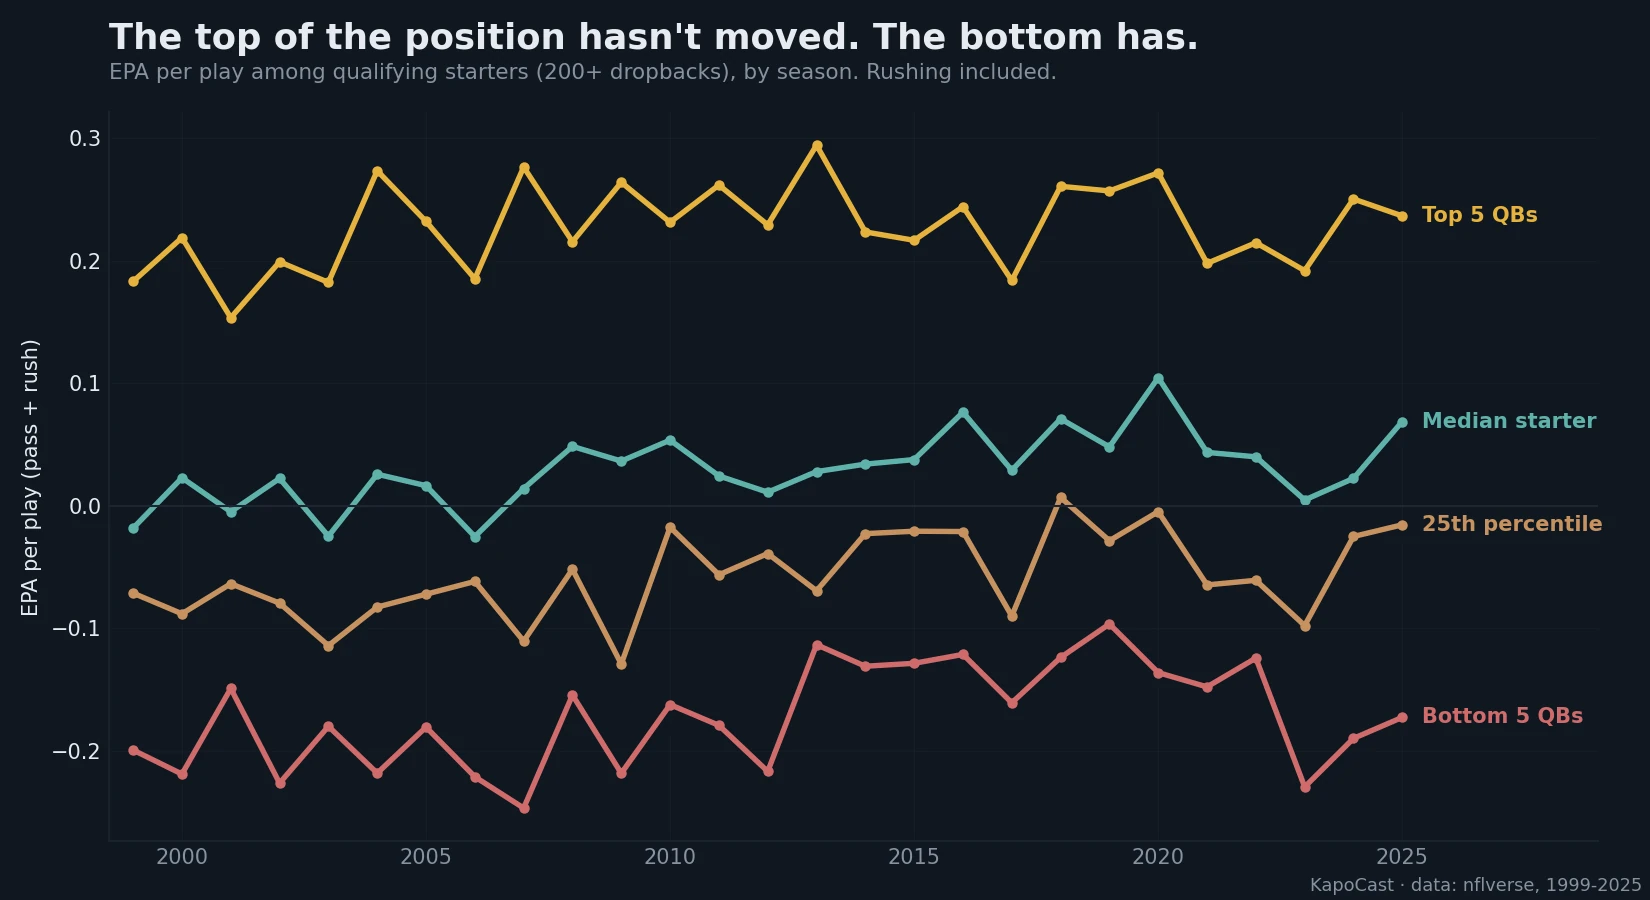
Start with the raw numbers, no era adjustment. The five best quarterbacks in the league produce about what the five best produced in 1999. Top-five EPA per play bounces between 0.18 and 0.29 for almost 30 years with no trend at all. The 2025 top five, Maye, Love, Purdy, Stafford, and Allen, graded out at 0.236. The 1999 top five, Warner, Manning, Brunell, Gannon, and Jeff George, graded out at 0.183. That is one good throw a game apart, over a quarter century of rule changes designed to help the passing game.
Now look at the bottom of the chart. A 25th-percentile starter in 1999, meaning the guy who was better than about nine other starters and worse than about 27, posted a 75 passer rating and negative 0.071 EPA per play. In 2025 that same slot posted an 88 rating and negative 0.016. The bad starter of today would have been a top-ten quarterback in 1999. The median starter went from roughly break-even to a solidly positive player. Everything at and below the middle of the position moved up, and the top stayed where it was.
Fewer Bad Seasons, Not More Elite Ones
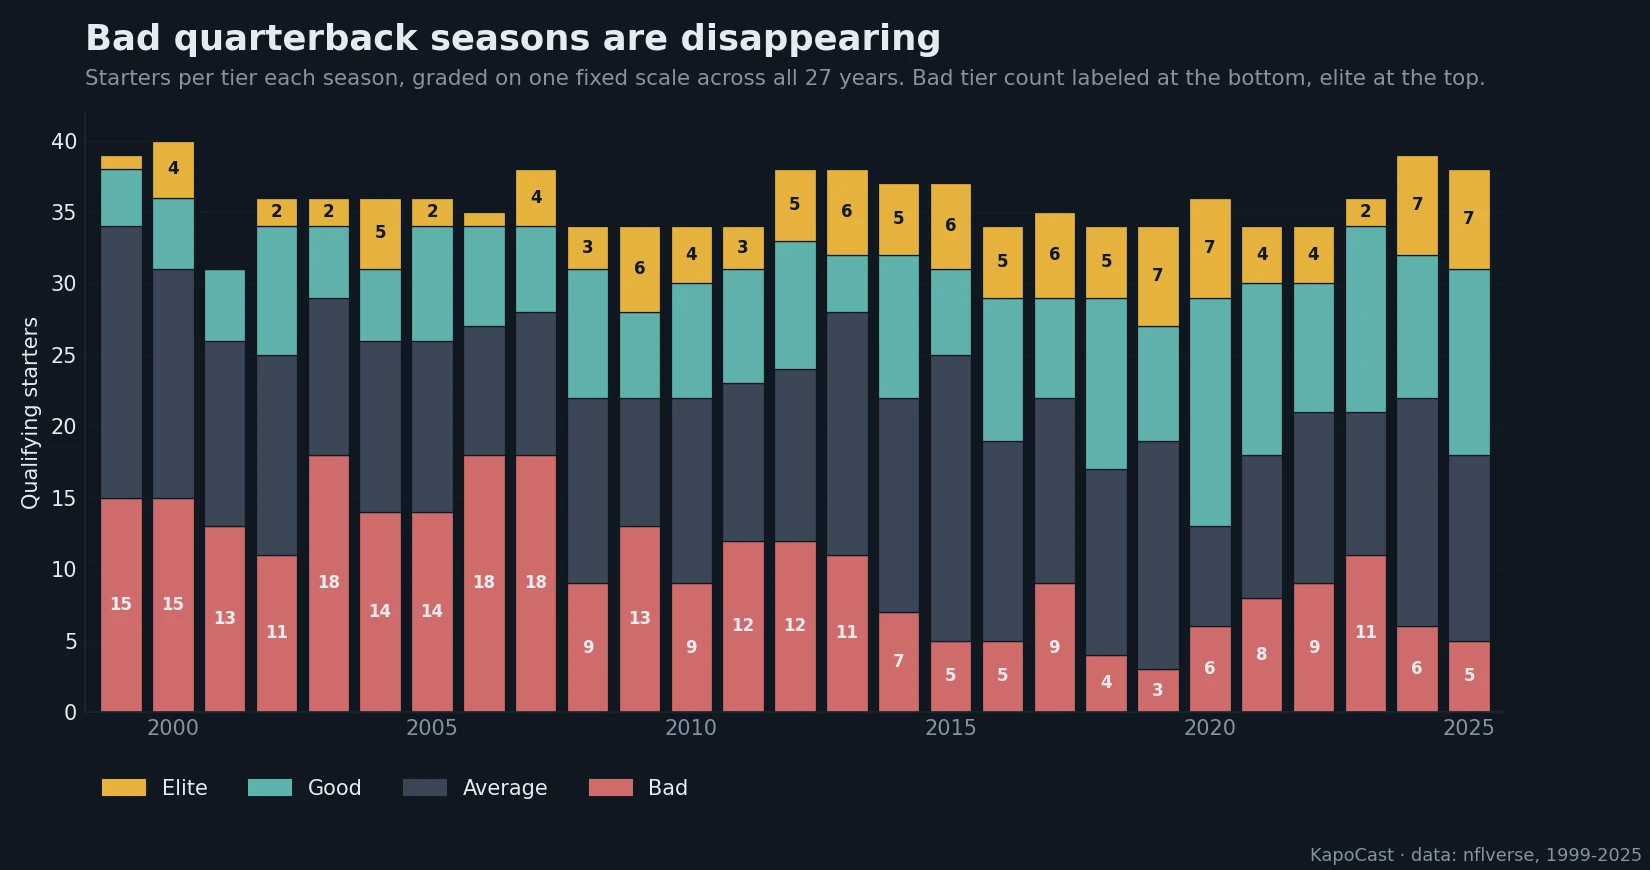
Here is the same thing as a count, with every season graded on one fixed scale so the tiers mean the same thing in 2003 and 2023. In the early 2000s the league had 15 to 18 bad quarterback seasons a year. Half the starters were bad by the standard of the whole period. Since 2018 it’s been between 3 and 9. The good tier went from four to nine a year up to ten to sixteen. The elite tier went from one to six a year up to four to seven, which is a bump. Some of that bump is the rules. But the elite tier grew by a couple of guys while the bad tier shrank by ten. That’s the whole answer to the question in the headline. There are not meaningfully more great quarterbacks. There are a lot fewer bad ones.
One caveat that cuts both ways. Part of the floor rising is the game. Defenseless receiver rules, illegal contact, the way the pass interference drifted, all of it makes an average quarterback’s numbers look better than they would have in 2004. Part of it is real, though. Teams draft the position differently, coach it differently, and bench a bad one faster than they used to. I can’t really cleanly separate the two in the data. What I can say is that the top five didn’t benefit from those rule changes nearly as much as the bottom fifteen did.
Elite Careers by the Numbers, Graded Season by Season
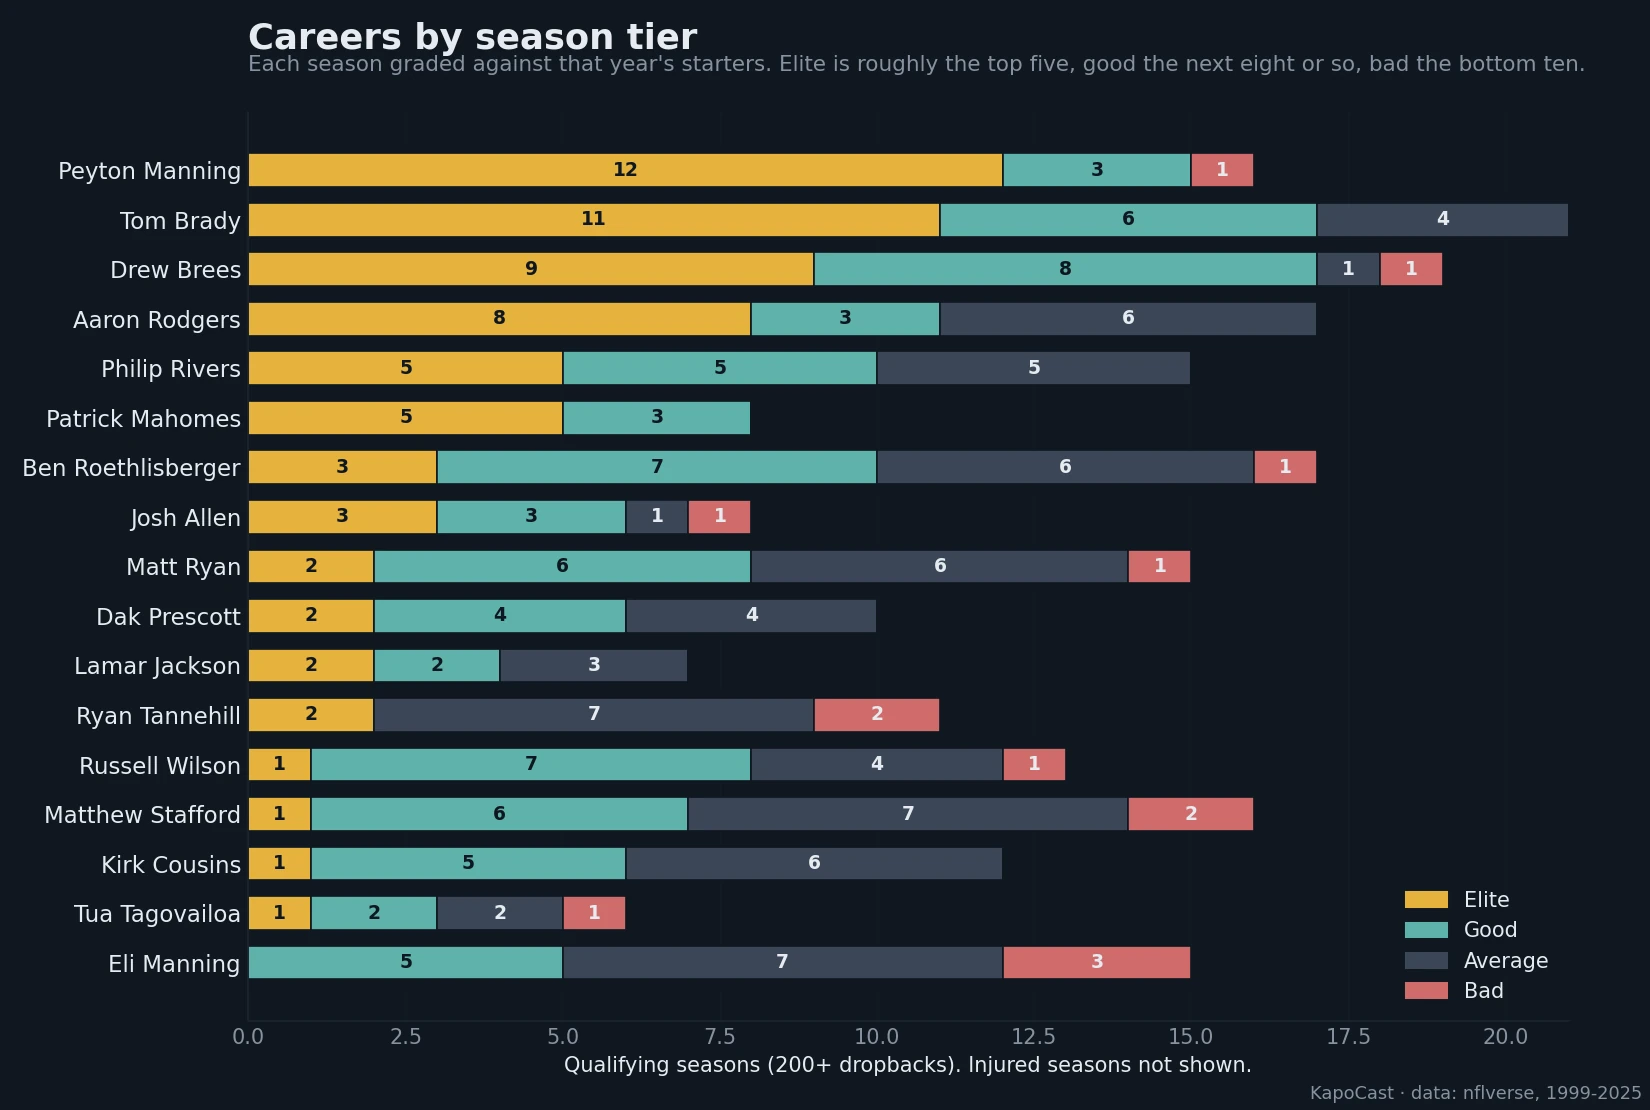
For careers I switched to grading each season against that year’s starters, so a 2005 season and a 2020 season are both judged by the company they kept. These are tiers of seasons, not a ranking of players. A guy with eight elite seasons and six average ones is a different kind of career than a guy with five elite and zero average, and which one you prefer is your business.
| Quarterback | Seasons | Elite | Good | Average | Bad | Playoff EPA/play |
|---|---|---|---|---|---|---|
| Peyton Manning | 16 | 12 | 3 | 0 | 1 | 0.083 |
| Tom Brady | 21 | 11 | 6 | 4 | 0 | 0.140 |
| Drew Brees | 19 | 9 | 8 | 1 | 1 | 0.146 |
| Aaron Rodgers | 17 | 8 | 3 | 6 | 0 | 0.180 |
| Philip Rivers | 15 | 5 | 5 | 5 | 0 | 0.135 |
| Patrick Mahomes | 8 | 5 | 3 | 0 | 0 | 0.242 |
| Ben Roethlisberger | 17 | 3 | 7 | 6 | 1 | 0.072 |
| Josh Allen | 8 | 3 | 3 | 1 | 1 | 0.239 |
| Matt Ryan | 15 | 2 | 6 | 6 | 1 | 0.103 |
| Lamar Jackson | 7 | 2 | 2 | 3 | 0 | 0.038 |
| Ryan Tannehill | 11 | 2 | 0 | 7 | 2 | n/a |
| Russell Wilson | 13 | 1 | 7 | 4 | 1 | 0.152 |
| Matthew Stafford | 16 | 1 | 6 | 7 | 2 | 0.195 |
| Kirk Cousins | 12 | 1 | 5 | 6 | 0 | -0.031 |
| Tua Tagovailoa | 6 | 1 | 2 | 2 | 1 | n/a |
| Eli Manning | 15 | 0 | 5 | 7 | 3 | 0.092 |
Regular season tiers graded against each year’s starters, 200-dropback minimum. Playoff column is career EPA per play in the postseason, 150-attempt minimum. Injured seasons are not counted either way.
Peyton Manning had twelve elite seasons and zero average ones (again this is purely graded by stats). His one bad season is 2015, the year he won the Super Bowl at 39 on Denver’s defense, which is the most Peyton thing in the whole table. Brady had eleven elite and four average, and one of the average ones, 2001, ended with a ring, which tells you how much of Brady’s legend is the other 20 games. Brees is right there with nine elite and only two seasons below good in nineteen years. Rodgers has eight elite seasons and six average ones, and that gap is the honest difference between him and the three above him. When Rodgers was on, he was as good as anyone who ever played. He was off more often than they were.
Mahomes is the outlier in the other direction. Eight seasons, five elite, three good, nothing else. Nobody else in the sample has eight or more seasons without a single average or bad one. His last three years, 2023 through 2025, all graded good, ranking 11th, 13th, and 12th among starters. By his standard those are down years. By the league’s standard they’re top-third seasons, and that’s exactly the point of grading this way. The tiers are the league’s standard, not X’s. A down year for Mahomes is a career year for two-thirds of the league.
Two comparisons people make that the data does not support. Rivers and Eli are not close. Rivers had five elite seasons and zero bad ones. Eli had zero elite seasons and three bad ones, and his best years graded good, never higher. Eli is the ultimate average quarterback you can win with, and he won twice against Tom Brady, and the second part of that sentence is why he’s in the conversation at all. Matt Ryan and Ryan Tannehill are also not close, though Tannehill is more interesting than I expected. Ryan has eight seasons at good or better. Tannehill has two, both elite, 2019 and 2020 in Tennessee, and then seven average and two bad.
When They Get There and How Long They Stay
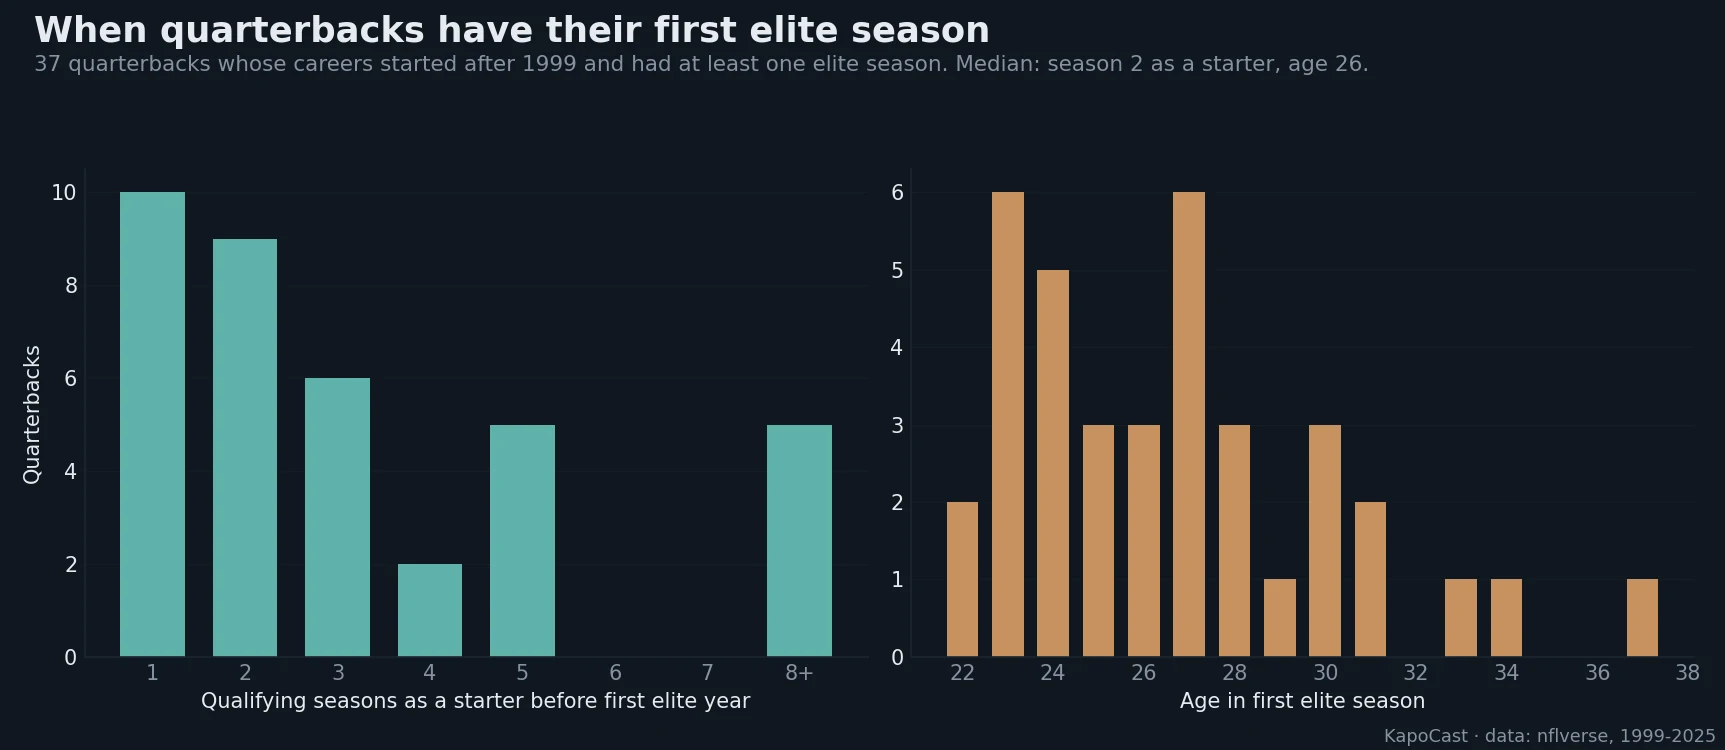
Thirty-seven quarterbacks who started their careers after 1999 have had at least one elite season. The median first one came in their second qualifying season as a starter, at age 26. Ten of them did it in year one, Mahomes, Dak, Lamar, Purdy, Culpepper, Griffin. Nine did it in year two. If a guy is going to be elite, you usually know inside two years. The late bloomers are real but rare. Stafford’s first elite season by this grading was his sixteenth, last year, at 37. I’d argue he was never elite though. Always good, always hanging around the top 10 even in Detroit. Alex Smith’s was his eleventh. Tannehill’s was his seventh, in a different city.
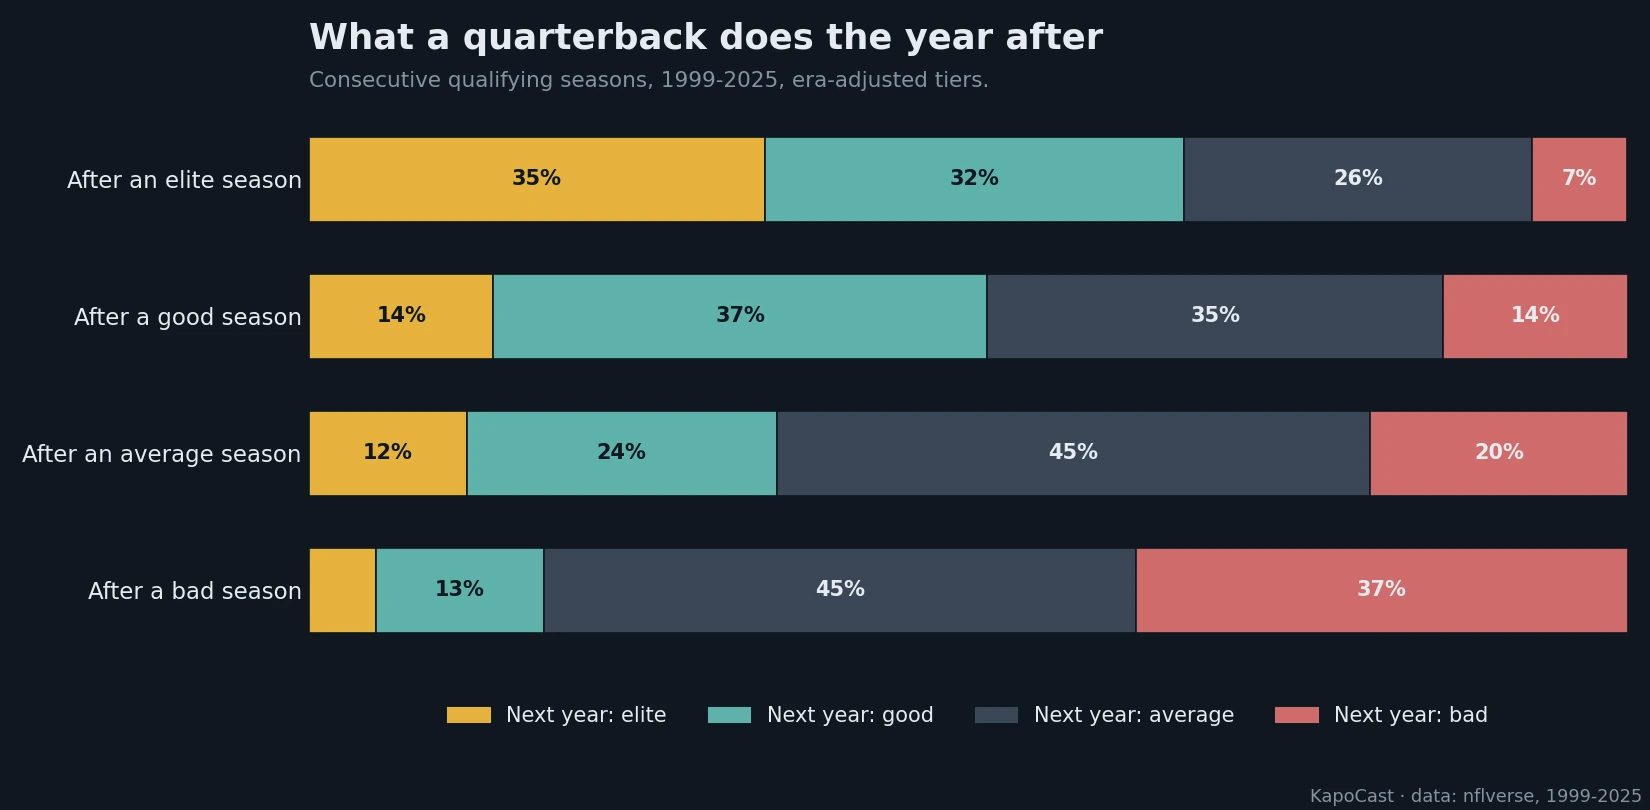
Staying is harder than getting there, as you’d imagine. After an elite season, a quarterback repeats it 35% of the time, drops to good 32%, to average 26%, and all the way to bad 7%. So one in four is followed by an average year. Now, a good season is followed by another good one 37% of the time and by an average one 35%, and only 14% of the time does a good quarterback jump to elite. The bottom is the part that should scare a general manager. After a bad season, the odds of the next one also being bad are 37%, and the odds of getting to elite are 5%.
January Is Its Own Column
I kept the playoffs out of the tiers, because ten postseason games shouldn’t reshuffle a 16-season regular-season record, but they get a column. Career playoff EPA per play, 150 attempts minimum, is in the table above. Mahomes leads at 0.242 over 21 games, and he’s the only one of the greats who plays better in January than he does in the fall in that regard. Josh Allen is right behind him at 0.239. Brady sits at 0.140 across 48 playoff games and 1,921 attempts, which is nearly twice the volume of anybody else, and his playoff number is a little below his regular season one. Peyton is the drop. His regular season EPA per play was 0.213, second only to Mahomes in the sample. His playoff number is 0.083, a fall of 0.130, the steepest of anyone with a serious career. Eli went the other way, 0.016 in the regular season and 0.092 in the playoffs. The grader and the rings agree about Eli in the only place they could.
As of 2026
Two weeks is not a season and I’m not grading it, but here’s where a few names sit against their 2026 peers in passing EPA per dropback. Purdy, Allen, and Drew Lock are the top three. Dak is fourth. Bryce Young is fifth. Mahomes is 12th, another good-not-elite start, and I’ll say it again, that is the league’s bar, not his. But, he’s also coming off injury. I think he’ll be just fine.
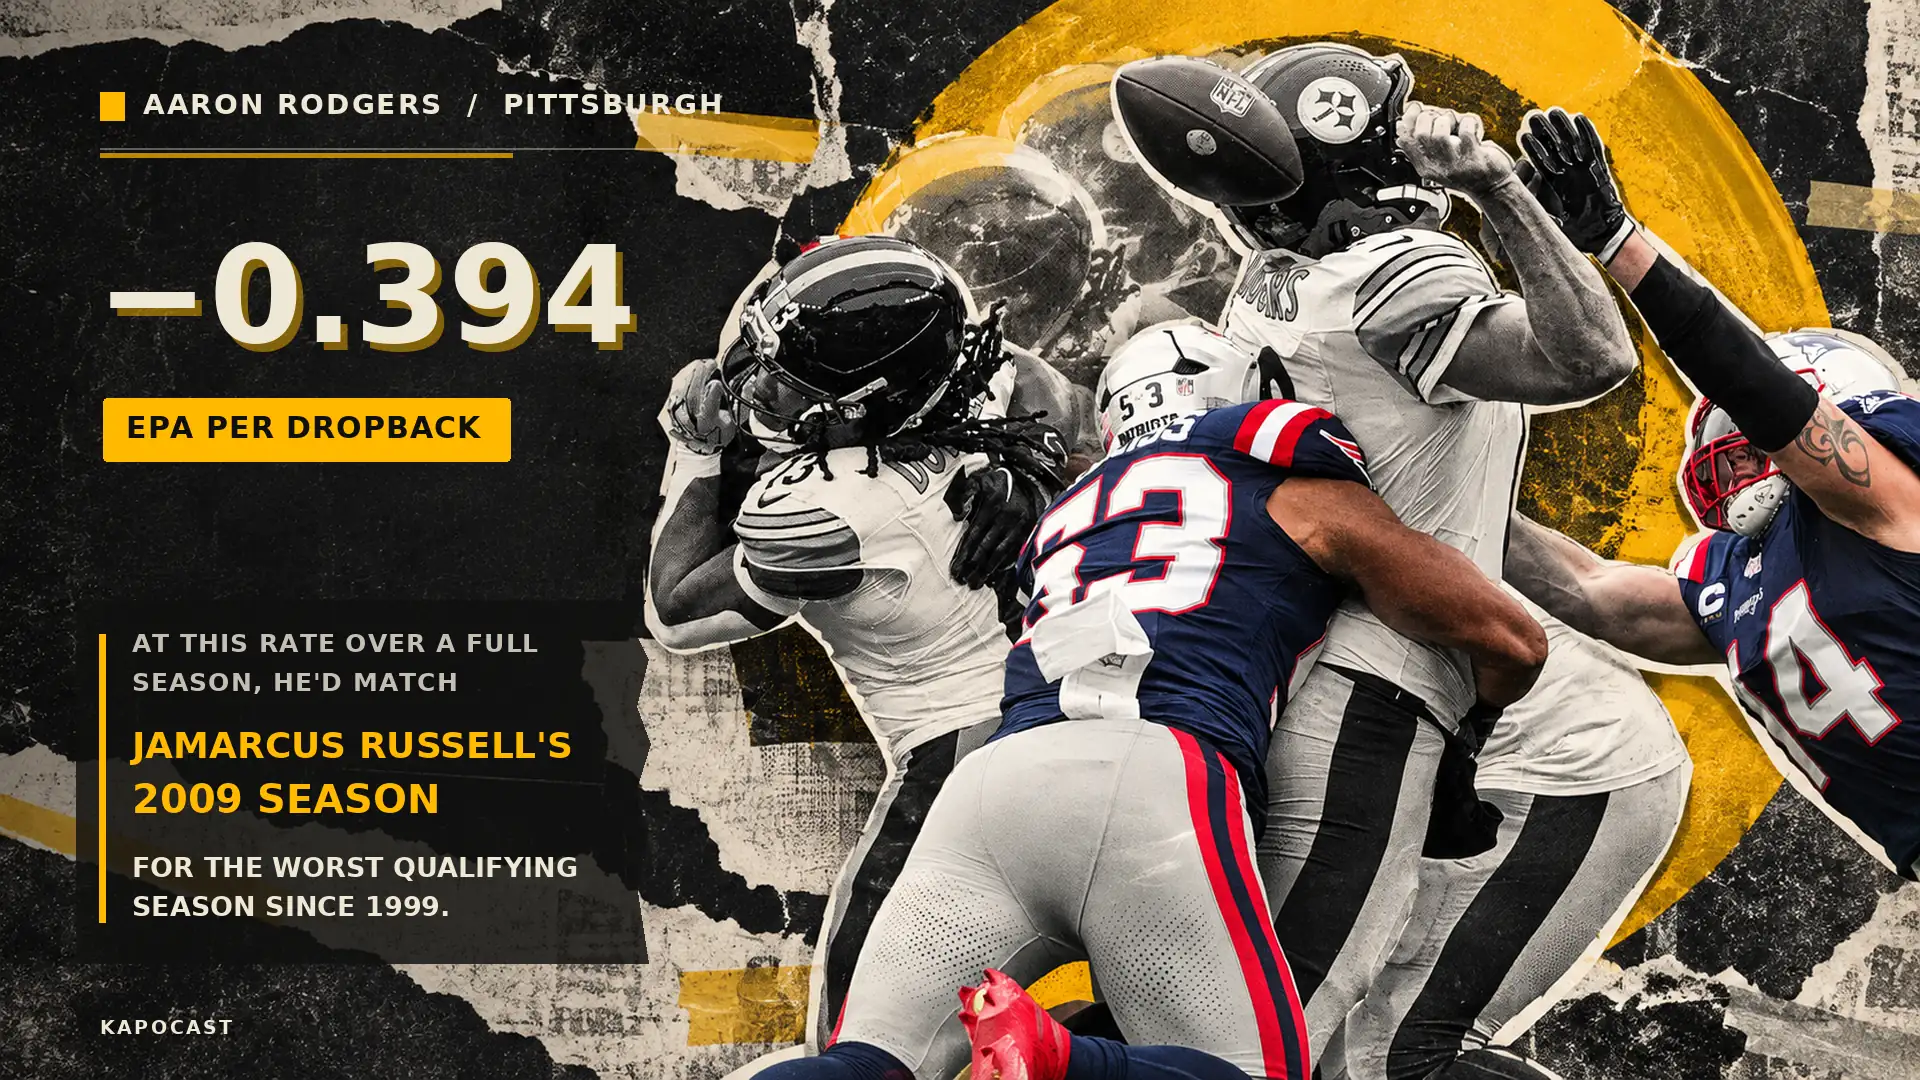
At the bottom, Drake Maye is 28th of 31 with four interceptions, Cam Ward is 26th, Justin Herbert is 25th, and Baker Mayfield and Aaron Rodgers are 29th and 30th. Rodgers in Pittsburgh is at negative 0.394 per dropback, which would match JaMarcus Russell’s 2009 as the worst qualifying season in the 27-year sample if he kept it up for a year.
So the floor rose, the ceiling didn’t. An elite season is still rare, still about three to five a year, still hard to repeat. The bar for keeping a job moved up by about 13 points of passer rating in 25 years. The bar for being the best didn’t move at all.